Funding and Incentives
The purpose of this page is to demonstrate the economic and political feasibility of our project proposal, specifically regarding the implementation process. This proposal may be implemented through different entities such as local governments, businesses, or companies. Funding for specific initiatives within our proposal can come from local grants, nonprofit donations, or government grants. For the overall project implementation, we recommend the utilization of the Puerto Rico Public-Private Partnerships Authority (P3A), which implements similar large-scale public interest infrastructure projects. However, it’s ultimately up to the local government or private entity that takes up this proposal to determine what specific financing model they want to utilize. The benefit of the P3A process is that the private party and the government share the risk of undertaking the project.
There are two procedures for the P3A project proposal process that depend on if the initial entity is a public or private entity. This allows for more accessibility to the P3 process, whether the initial interest is public or private.
1) General Process (P3A, 2017)
This default procedure applies when the initial proponent is a government (public) entity.
A government entity with a public interest goal refers a project to the P3A Board of Directors. The proposal goes through committees to evaluate the feasibility of the project. This proposal is then published in a Request for Qualifications (RFQ) where private companies can nominate themselves to implement the project. The key here is that the private entity that chooses this proposal would implement it rather than the government entity that proposed it. It goes through a couple more committees, and ultimately it must get approval from the governor.
2) Unsolicited Proposal Process (P3A, 2019)
This second procedure applies when the initial proponent is a private entity that is interested in implementing the project.
A potential private entity submits a proposal to P3A. The entity must pay a non-refundable evaluation fee of $5,000. While this is a large sum of money that a company may not have on hand, P3A can credit back up to 100% of this fee if the project or private company is selected. The proposal goes through several evaluations. The private entity that submitted the proposal is not guaranteed to be the one to implement the proposal, however it has an advantage because it submitted it.
Investing in and creating resilience hubs through a Public-Private Partnership could be appealing for private companies like agricultural companies, construction firms, and engineering consulting companies due to the following reasons:
- For the duration that the private company is agreed in the Concession Agreement to be in charge of construction and operation of the project, the company is in charge of operational costs, but is also entitled to revenue gained from the project that can partly offset the investment (P3A, 2011). Within the scope of this project, this revenue would come from the community supermarket in the resilience hub. Resilience hubs are meant to be located in places with less access to food and could, therefore, have steady revenue as a result of their importance for the local community.
- Resilience hubs would encourage local economic growth. Since these hubs provide a place of employment as well as supporting local farmers and businesses, a local private company might be interested in investing in economic growth.
- A P3A agreement can serve as a pilot project that lets the private entity share risk with the government, acting as a good source of information for agricultural companies and structural engineering firms to base future projects on.
- A local agricultural company can use this resilience hub to connect its local farmers to steady and reliable buyers.
Though our main recommended implementation method is through the P3A, resiliency hubs can be implemented in other ways. In addition to P3A, sourcing funding for resilience hubs can also come from the revenue generated from the community supermarket since every resilience hub has a community supermarket incorporated within it. Additionally, donations could be secured from NGOs.
Location
Placing a resilience hub depends on many factors. Since every neighborhood in Puerto Rico is unique and can differ widely within a small area, these factors shouldn’t be generalized to one municipality. While choosing a location for a resilience hub, factors such as population density, food accessibility, income, disaster resiliency, and more should be considered.
Accessibility
Population density and accessibility to stores within walking distance is a good metric to decide where to place resilience hubs. Placing resilience hubs in more populated areas would increase their impact, while putting them in areas that don’t already have grocery stores nearby can increase a community’s reliable access to food.
This map shows how many grocery stores are within 10 minute walking distance (data from Safegraph, data supplied in ArcGIS map (2025)). A population density map is layered over to show a positive correlation between grocery store accessibility and population density. It should be considered to place a resilience hub in a higher populated area that may not have a grocery store nearby. This can be seen in the map where on the outskirts of cities, there are areas with higher populations and lower accessibility.
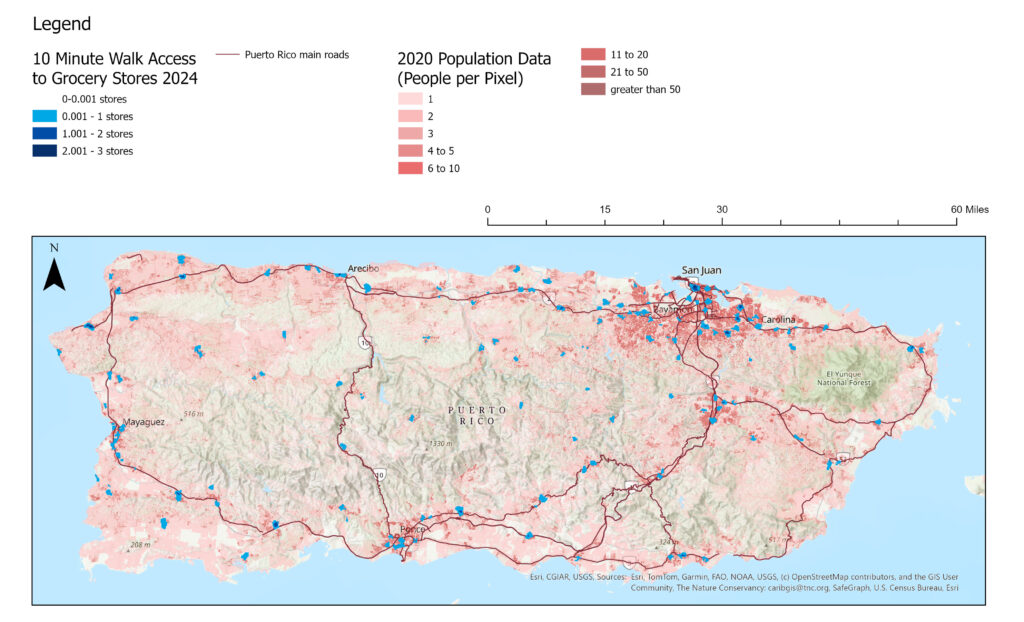
This map shows how many grocery stores are within 10 minute walking distance (data from Safegraph, data supplied in ArcGIS map (2025)). ArcGIS Street Map Premium was used to determine which roads are walkable. There is some uncertainty in the data, as many roads lack side walks, are too narrow, or have too sharp of an incline to safely walk. These issues are further exacerbated during disasters due to landslides and flooding. However, the map still provides a useful estimate of proximity to grocery stores.
A population density map is layered over to show a positive correlation between grocery store accessibility and population density. Highly populated areas with less access to grocery stores should be prioritized for resilience hub placement. These areas, as seen in the map, are particularly prominent in the outskirts of the larger cities.
Grocery stores within walking distance are more concentrated in major cities, particularly San Juan, Ponce, and Mayagüez, with very few inland. For people living inland, grocery stores are often only accessible by driving. As shown by the map, there are fewer areas with grocery stores within walking distance inland. Walkable grocery stores tend to be concentrated in high population density areas and in close proximity to main roads.
It is harder for people to access grocery stores during disaster times if roads are damaged or fuel is scarce. (see our Background page). Considering this, resilience hubs should be located in communities that don’t already have a grocery store within walking distance.
Considering the population density, there should be a distribution of some larger resilience hubs in more populated areas (such as San Juan or Ponce) and some smaller resilience hubs further inland, in places that don’t have access to the main roads. Targeting different demographics and changing the size of the resilience hub will allow the hubs to impact a broader range of people in different situations. Socially vulnerable areas that may have lower income and/or lower population density should be prioritized for placement of smaller resilience hubs. Running pilot programs and expanding them over time would allow resilience hubs to spread to more areas.
Labor
In order to propose an effective solution, considering the demographics of the Puerto Rican population is essential.
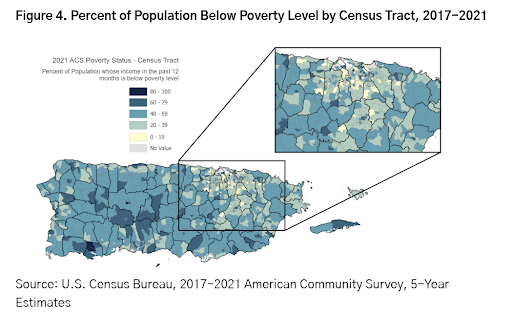
Currently, the unemployment rate in Puerto Rico sits at 5.6% (Economy at a Glance – Puerto Rico, 2025), a rate slightly higher than what’s considered ideal by most economic standards (Saez). However, the distribution of unemployment varies throughout the island, with the southern parts of the island experiencing higher rates of unemployment. Additionally, by comparing it to data illustrating population percentage below the poverty line, we noticed a correlation between higher unemployment rates and higher poverty rates. This illustrates that food insecurity is a greater issue in areas where unemployment rates are higher, and gives us an idea of the areas that would most benefit from our proposed solution.
Additionally, the average age of the Puerto Rican population is getting higher (Matos-Moreno et al., 2024). This is partially due to the high emigration rates out of Puerto Rico in the 2010s (Krogstad, 2024), as many youth left the island to pursue employment and other opportunities.
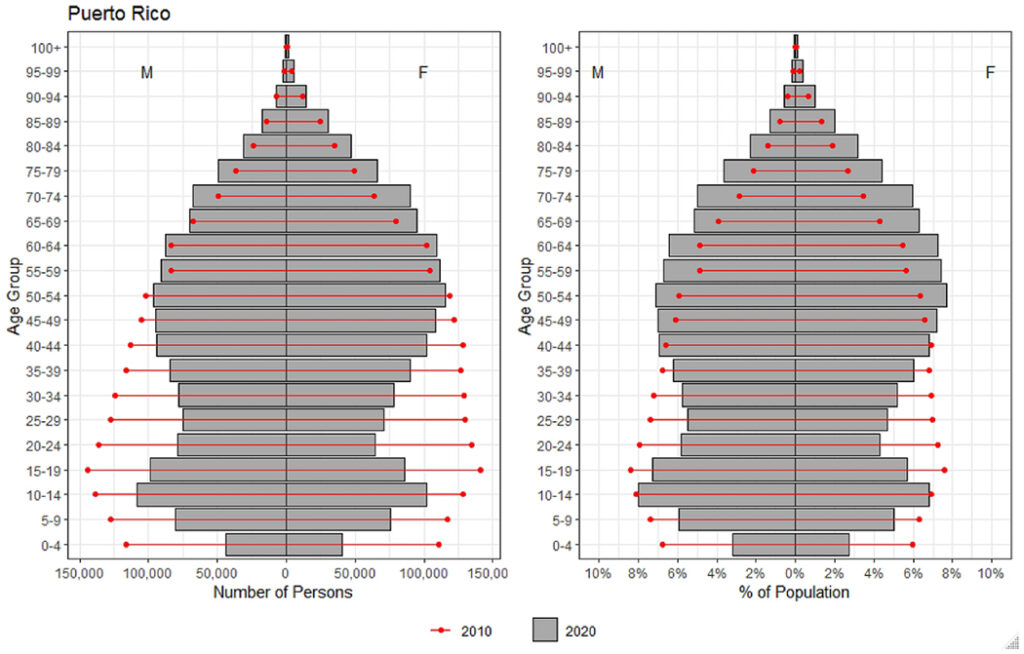
In fact, Puerto Rico has only begun reporting net migration gains again in 2024 (Kantrow, 2025). Reducing emigration is important because the elderly are socially vulnerable; a more equal age distribution on the island would contribute to a Puerto Rico that is more resilient.
If our solution is implemented, the reduction of food insecurity and increase in opportunities (as elaborated on in Education and Community Supermarkets) in Puerto Rico would hopefully encourage more people to stay, creating a positive feedback loop contributing to Puerto Rico’s resilience. If our proposed solution is effective, we would expect to see lower unemployment rates in the southern part of the island and a more equal age distribution.
Income Considerations
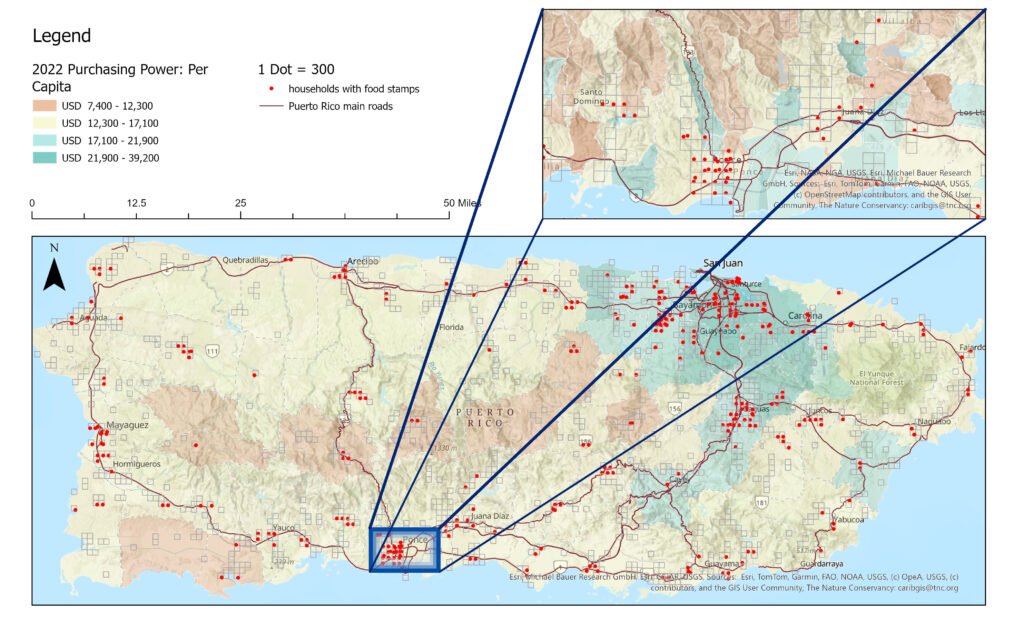
Purchasing power (data from Esri Demographics Team, 2025, displayed with ArcGIS) and households with food stamps (data from FEMA, displayed with ArcGIS). These maps show municipalities and their purchasing power, or the disposable income of that area. Areas with higher purchasing power would be able to spend more on local food than areas with lower purchasing power. Zooming in can show that even within municipalities, there are large variations in purchasing power only a few neighborhoods away. Households with food stamps provide an indicator of areas that may have more robust food assistance programs.
Purchasing power is defined as the disposable income of the population in each municipality. Central areas of Puerto Rico have the least purchasing power and may be at higher risk of food insecurity, especially in emergencies or disasters when prices elevate. Since purchasing power can vary greatly, as shown above in the zoomed-in image of Ponce, it’s important to note that a resilience hub should consider areas specifically and not broadly. These things cannot be generalized to one municipality and should be looked into closely.
Food stamps in Puerto Rico are known as NAP, or Nutrition Assistance Program. Food stamps are most commonly concentrated in cities (San Juan, Caguas, Ponce, Mayagüez). This is because there is a greater density of people, which correlates to a greater number of people on food stamps. This adds to less security in rural areas that also have less purchasing power and less people on food stamps. Due to both of these factors, rural areas do not have reliable access to affordable foods. NAP by itself may not be a good indicator of how many people may need food assistance since only half of people below the poverty line are eligible for NAP (Martinez, 2025). This map of households with food stamps is a good way to identify areas that may not have a robust NAP program and would benefit from a resilience hub.
Disaster Resiliency
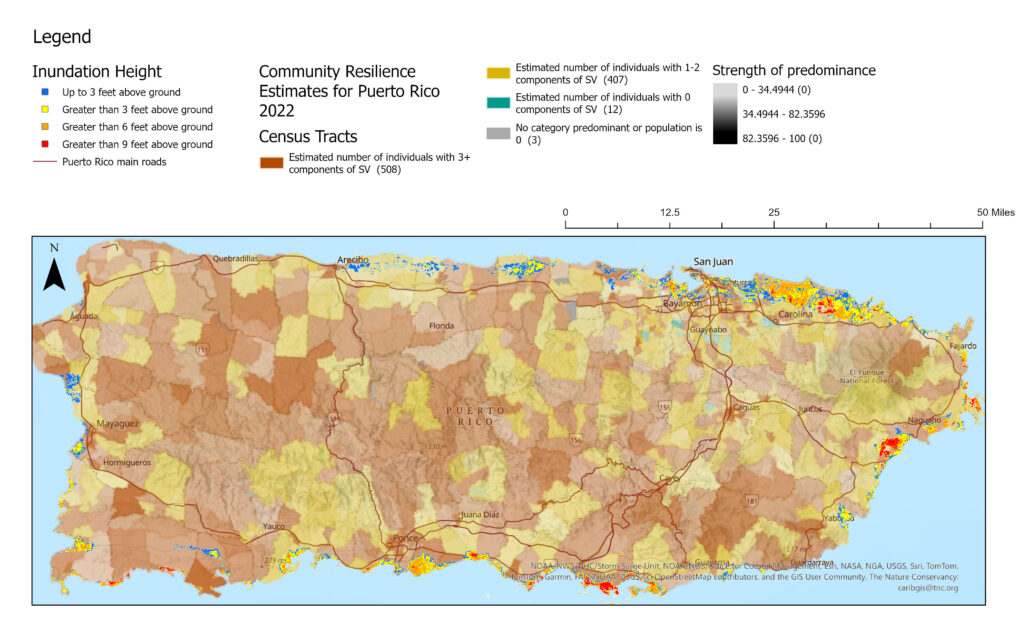
Community resilience is a measure of social vulnerability (SV), or susceptibility to public health hazards, natural disasters, and socioeconomic factors, by municipality. More components of social vulnerability suggest lower community resilience to general changes and disasters. This map also features Inundation Height, or the amount of flooding from a storm surge. This is representative of how much flooding an area will experience during a hurricane or natural disaster.
From the U.S. Census Bureau, 2024, these SV (Social Vulnerability components) include:
- SV 1: Income-to-Poverty Ratio (IPR) < 130 percent (HH).
- SV 2: Single or zero caregiver household – only one or no individuals living in the household who are 18-64 (HH).
- SV 3: Unit-level crowding with > 0.75 persons per room (HH).
- SV 4: Communication barrier defined as either: Limited English-speaking households or no one in the household with a high school diploma.
- SV 5: No one in the household is employed full-time, year-round. The flag is not applied if all residents of the household are aged 65 years or older.
- SV 6: Disability posing a constraint to significant life activity. Persons who report having any one of the six disability types: hearing difficulty, vision difficulty, cognitive difficulty, ambulatory difficulty, self-care difficulty, and independent living difficulty.
- SV 7: No health insurance coverage.
- SV 8: Being aged 65 years or older.
- SV 9: No vehicle access.
- SV 10: Households without broadband internet access.
Socially vulnerable areas are concentrated in more rural areas such as inland PR. Smaller resilience hubs should be located in these socially vulnerable rural areas.
(U.S. Census Bureau, 2024)
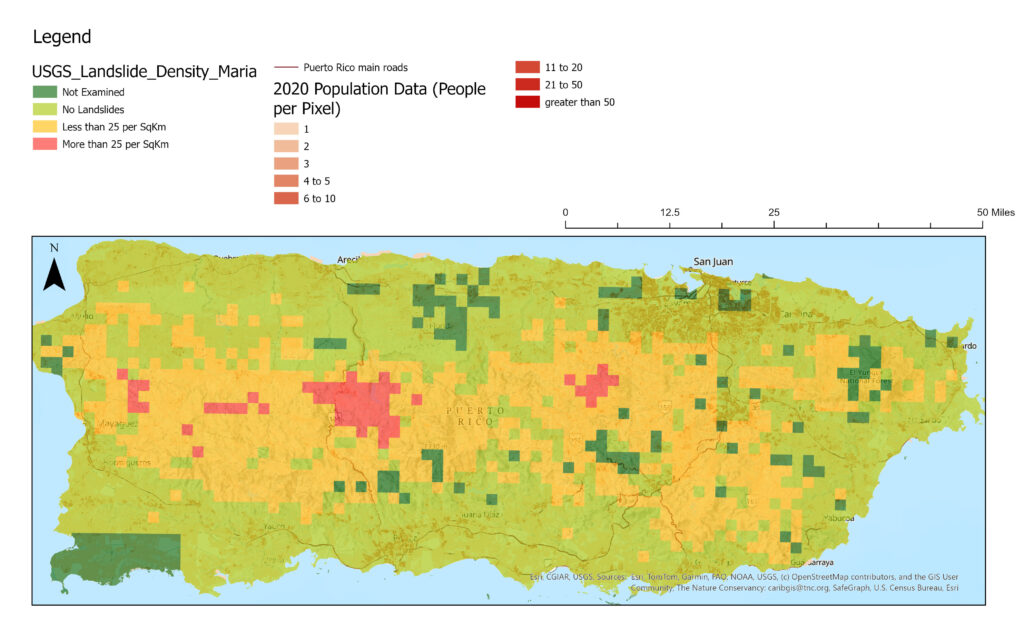
This map shows that inland, there are also high chances of landslides from disasters. This is important to take note of because even though these inland areas may not be flooded, they still experience a great impact from a hurricane through landslides, which block roads and make them unsafe to walk as well, further cutting off people from food sources. This is another reason why a location inland with high chances of landslides and low social vulnerability would be considered for a resilience hub.
Additionally, while flood hazard and landslides by themselves might not be good indicators of which areas are impacted the most, the amount of electricity lost or recovered after a hurricane is representative of this.
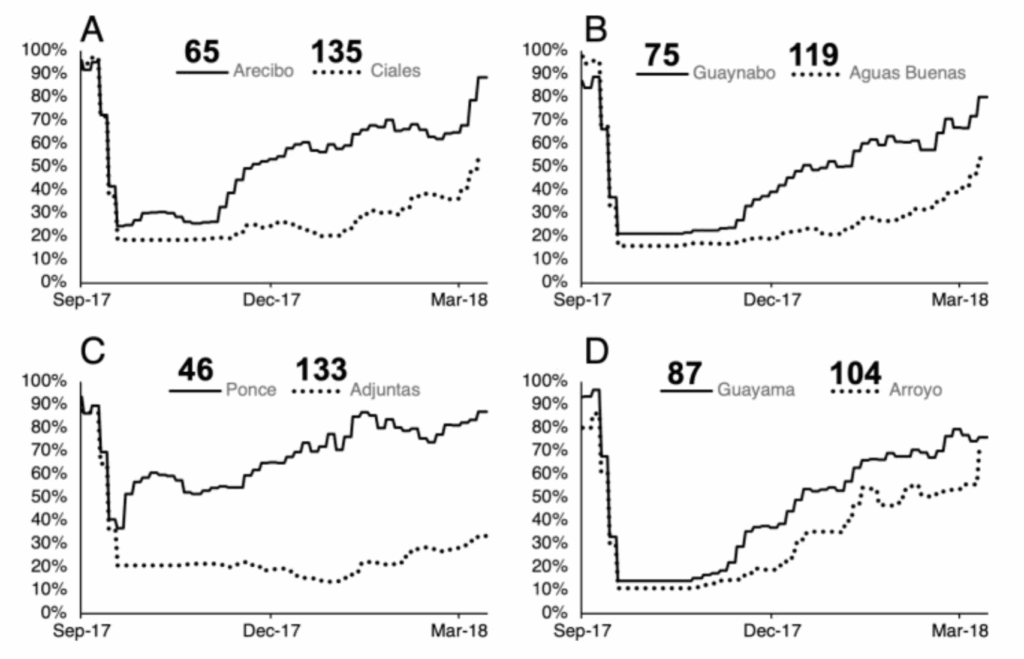
Roman et al. illustrates how recovery times and stages can vary widely depending on region. These varying recovery times can depend on population size, vulnerability, and income level. For example, the recovery time of Ponce is relatively short compared to Adjuntas. Ponce got most of its power back 3-4 months after Hurricane Fiona, but Adjuntas hadn’t recovered even a fourth of its power by then. Adjuntas is a more remote area further inland. This case illustrates how recovery times can vary greatly for different regions.
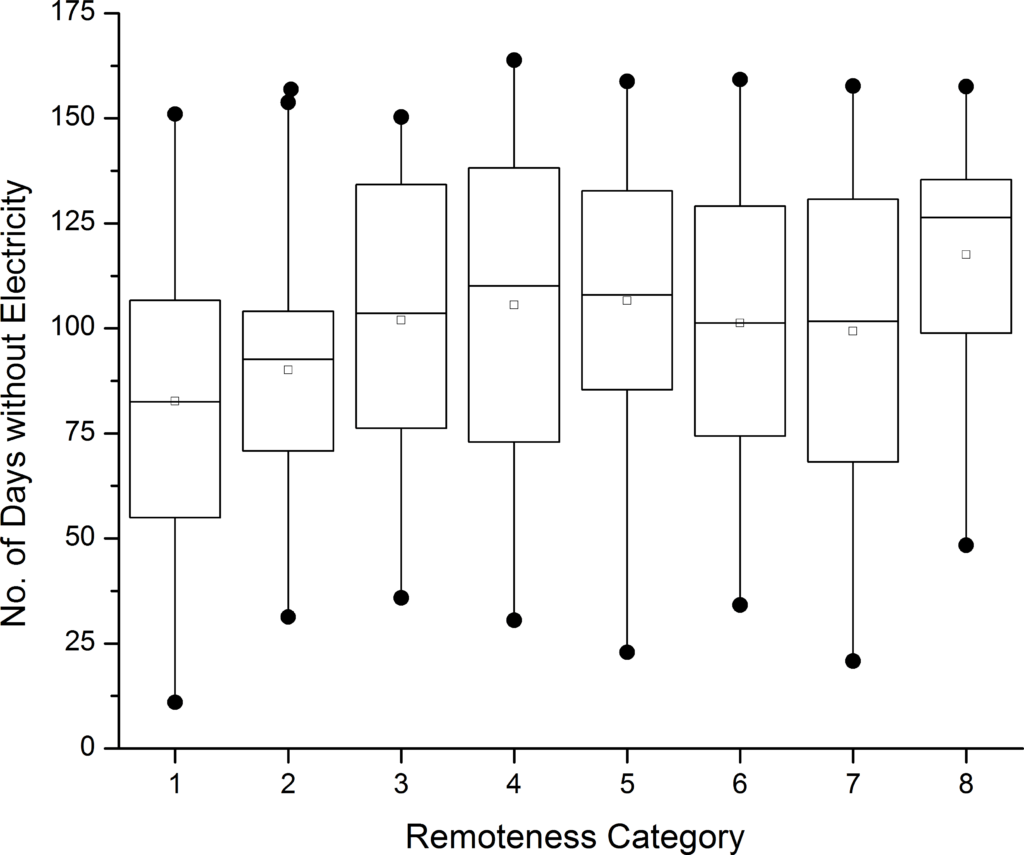
This chart shows that recovery time progresses proportionally to the increase of remoteness of an area (from 1, least remote, to 8, most remote). This means that the further inland or rural you go, the more time that area will take to recover electricity for its residents. This is vital because even though one area may lose more electricity than another, it is also very important to look at the long-term impacts of a hurricane or blackouts on an area. Establishing resilience hubs in areas that take long to recover power can help a community recover more quickly.
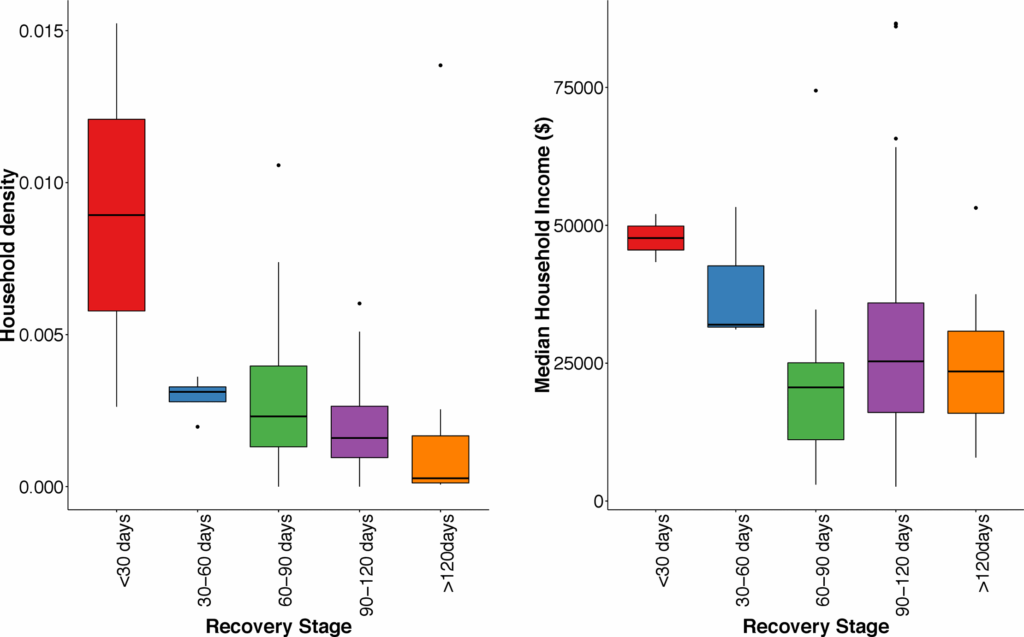
This boxplot illustrates how recovery time increases as household density decreases. More wealthy neighborhoods also have a quicker recovery time compared to lower-income areas. Resilience hubs should also be placed in lower median household income areas, as these areas would more likely have a slower recovery time.
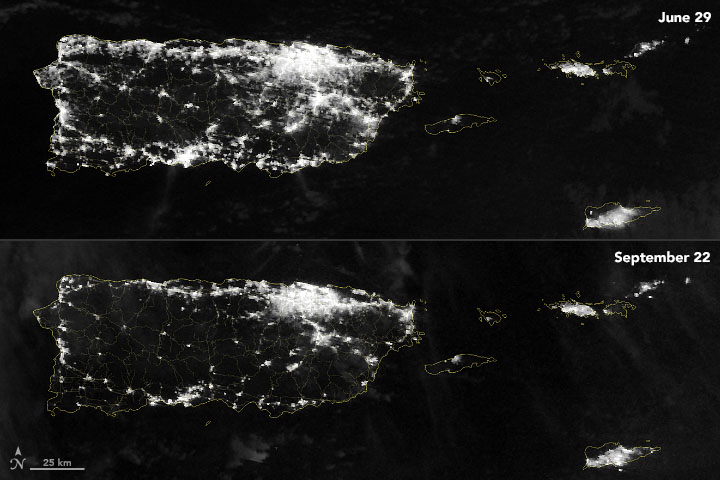
This map shows the before and after of Hurricane Fiona, with June 29th being the baseline and September 22nd being shortly after the hurricane. While this image doesn’t tell the whole story of which areas regained power the fastest, it does show that power is almost completely lost inland. Cities like Ponce and Arecibo experienced widespread power outages after Hurricane Fiona.
Considering these factors, some resiliency hubs should be in the vicinity of areas that are prone to losing power or being damaged, and more planning for emergency supplies should be undertaken. Since losing power entails not being able to refrigerate or properly store food, resiliency hubs can be key to providing vulnerable areas with shelf stable foods during blackouts. More focus will be given to disaster resiliency if an area is at more risk of being impacted severely by disasters. If an area is not as impacted by disasters themselves but experiences food insecurity due to remoteness or lack of accessibility, then long term solutions such as education or community supermarket functions would be prioritized. Areas that have a slower recovery time and higher percentage of power outages would be prioritized since power outages greatly affect how much food a family has. This slower recovery time is proportional to remoteness, population density, and income levels. All of these factors will be taken into consideration.
Placement Process for Resiliency Hubs
Communities that experience low community resilience, lower purchasing power, high likelihood of losing power, slow recovery time, and accessibility to food would benefit more from resilience hubs.
Case Studies and Examples
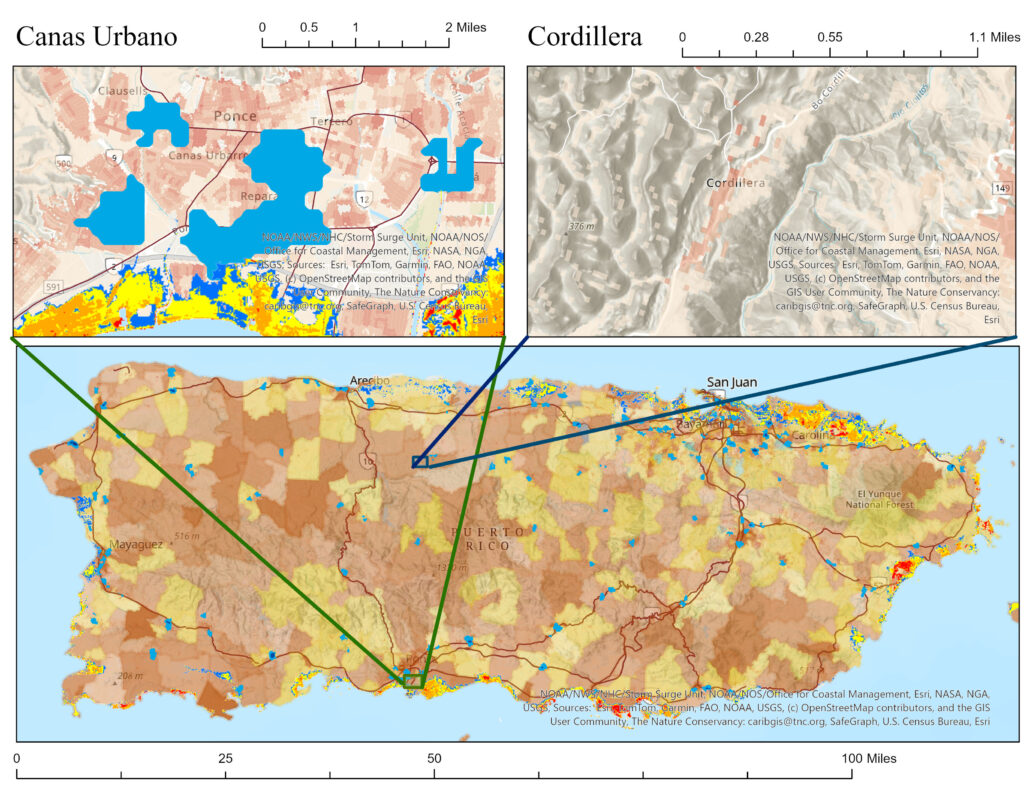
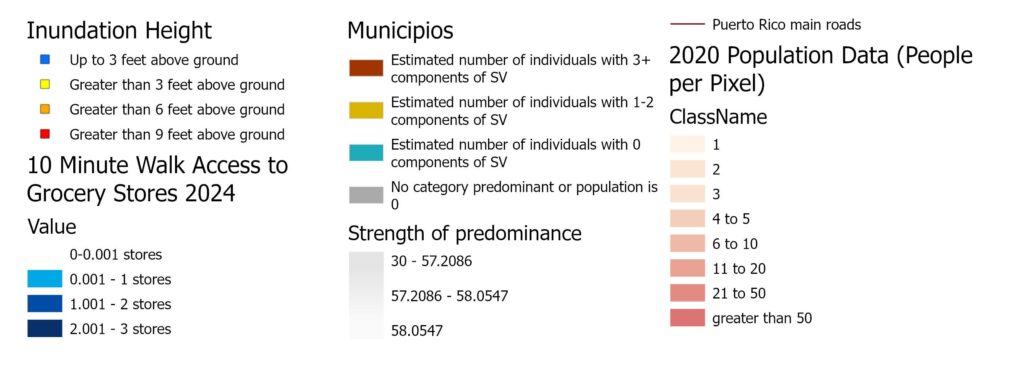
This map shows two possible case studies: Canas Urbano (Ponce municipality) and Cordillera (Ciales municipality), along with their respective locations on a larger Puerto Rico map. Factors such as storm surge (Inundation height), accessibility to grocery stores within walking distance, Social Vulnerability (SV) of municipalities, and population density are shown in this map. The process of taking into consideration these factors is discussed in length further down.
The reasoning and process for choosing these two potential pilot project areas:
Canas Urbano:
Canas Urbano is within the municipality of Ponce, and a resilience hub in this location could serve a great number of people. The resilience hub would have to be larger to impact the greatest number of people possible. Additionally, Canas Urbano is right by a storm surge zone, which suggests that this area is at risk of flooding. While being a larger resilience hub, Canas Urbano would be able to serve the outskirts of Ponce, which would have a longer recovery time than the main city. This can be seen in the correlation between remoteness and recovery time. Therefore, a resilience hub in Canas Urbano would ensure quicker recovery time for both residents in and out of city limits since Canas Urbano is at the edge of Ponce.
Canas Urbano has more grocery stores within walking distance, but these grocery stores probably close during disaster times. As written in the Background section, one of the main barriers to getting food during disaster times is the closing of grocery stores. Prioritizing the disaster resiliency function of a large resilience hub here would provide the food needed when these grocery stores shut down. If we also consider the table above, since Canas Urbano has a higher percentage of people who don’t have cars, placing a resilience hub in a more populated area would ensure reliable access to food within walking distance. This lack of accessibility to cars would exacerbate the issue of accessibility to food during disaster times when these grocery stores do close.
Considering the high social vulnerability of Canas Urbano and higher poverty rate (U.S. Census Bureau, 2025), residents would also benefit from having access to affordable shelf-stable foods during disaster and non-disaster times. Education about disaster resiliency and spreading information effectively would also be worked toward in this resilience hub. These would be more long-term facets with more focus on developing disaster resilient protocols first.
Cordillera:
Cordillera is a neighborhood located in the Ciales municipality. It’s a small part of a collection of neighborhoods in the mountainous region. Compared to Canas Urbano, the Cordillera neighborhood is much smaller, more remote, and has a higher poverty rate of 76.8% (U.S. Census Bureau, 2025). Considering this, a resilience hub in the Cordillera neighborhood would be smaller to better fit its population size.
As seen above, Cordillera doesn’t have any grocery stores within walking distance, meaning residents don’t have reliable access to food without a car. Additionally, since Cordillera is inland and remote, blackouts will be more common than in Canas Urbano. If electricity does go down, recovery time is very slow in remote areas (Roman et al., 2019). These blackouts exacerbate the issue of low food accessibility. If blackouts do happen, then food spoils in the fridge and stores nearby, making residents take another road trip to the nearest grocery store. If residents can’t drive or drive too far, then this is an important issue that would be solved with a resilience hub within walking distance.
In a small community, it’s vital to have a resilience hub within walking distance because the steep roads make it difficult to drive to grocery stores during a disaster. Even though Cordillera is not in an area with a high risk of landslides, other inland areas would have to take precautions for this. Severe landslides would prevent driving and even walking. If this were the case, a resilience hub would have to be strategically located to avoid damage, as well as have some other reliable way to get to the resilience hub.
While Cordillera may not be at risk of flooding like Canas Urbano, the threat of blackouts makes it important that the resilience hub provides shelf-stable food (Resilience Hub). The functions of a resilience hub here would focus more on long term initiatives such as local food production and agriculture education. Emphasis should also be placed on the day-to-day community supermarket function, where residents should have reliable access to affordable food.
Comparing and contrasting these two possible pilot programs and previous considerations, it’s clear that when deciding where to place a resilience hub, many different factors should be taken into consideration. Different factors can exacerbate others, so solving one issue may inadvertently help another. The size and functions of the resilience hub also depend on whether or not an area has more or less population, faster or slower recovery time, and poverty level. Overall, choosing areas for resilience hubs should involve careful consideration that takes into account many different factors that are discussed above.
Funding References
Federal Highway Administration. (n.d.). Project Profile: Puerto Rico Toll Roads Monetization Project (PR-52, PR-20, PR-53, and PR-66). Center for Innovative Finance Support. https://www.fhwa.dot.gov/ipd/project_profiles/pr_toll_roads_monetization.aspx
Puerto Rico Office of Management and Budget. (n.d.). Public-private partnership (P3) guidelines [PDF]. Commonwealth of Puerto Rico. https://docs.pr.gov/files/P3-PublicaPrivadas/P3/P3%20guidelines/up-guidelines-p3.pdf
Puerto Rico Public-Private Partnerships Authority (2011, June 27). Toll Road Concession Agreement. https://docs.pr.gov/files/P3-PublicaPrivadas/Projects/Projects/Highways-Metropistas/2011-6-27-Autopistas-Metropolitanas-de-PR-Concession-Agreement.pdf
Puerto Rico Public-Private Partnerships Authority. (2017, February 2). Public-Private Partnership Act. https://docs.pr.gov/files/P3-PublicaPrivadas/P3/Enabling%20Act/law29-2009english.pdf
Puerto Rico Public-Private Partnerships Authority. (2019, January 24). Guidelines for The Preparation, Evaluation, Selection, and Procurement of Public-Private Partnerships Through Unsolicited Proposals. https://docs.pr.gov/files/P3-PublicaPrivadas/P3/P3%20guidelines/up-guidelines-p3.pdf
Puerto Rico Public‑Private Partnerships Authority. (n.d.). Guidelines for the preparation, evaluation, selection, and procurement of public‑private partnerships through unsolicited proposals. https://docs.pr.gov/files/P3-PublicaPrivadas/P3/P3%20guidelines/up-guidelines-p3.pdf
Puerto Rico Public-Private Partnerships Authority. (2025). 2025 LIST OF PRIORITY PROJECTS. https://www.p3.pr.gov/projects
Location References
Esri Demographics Team. (2025). 10 minute drive access to grocery stores 2024. ArcGIS. https://www.arcgis.com/home/item.html?id=3afdbb6bb3344573ae9a56db939b7bda
Esri Demographics Team. (2025). Puerto Rico purchasing power per capita. ArcGIS. https://www.arcgis.com/home/item.html?id=671fc4557fb84cf9b278804e23d08f54
FEMA. (2022). POST Puerto Rico Flood Risk for Fiona V3. ArcGIS. https://fema.maps.arcgis.com/home/item.html?id=b3df934d403b4f18803dda531f8c828f&sublayer=0
Martinez, M. (2025, July 16). High prices, blackouts and half the money: Inside Puerto Rico’s stagnant food aid system. The 19th. https://www.msn.com/en-us/news/us/high-prices-blackouts-and-half-the-money-inside-puerto-rico-s-stagnant-food-aid-system/ar-AA1IHMSO
NOAA GeoPlatform. (2019). Puerto Rico and USVI (Category 5 Storms SLOSH MOMs) storm surge. https://noaa.hub.arcgis.com/maps/0c8f352139e04859811980fc1580057b/explore?location=18.300450%2C-65.848050%2C8
Roman, M. O., Stokes, E. C., Shrestha, R., Wang, Z., Shultz, L., Carlow, E. A. S., Sun, Q., Bell, J., Molthan, A., Kalb, V., Ji, C., Seto, K. C., McClain, S. N., & Enenkel, M. (2019). Satellite-based assessment of electricity restoration efforts in Puerto Rico after Hurricane Maria. PloS one, 14(6), e0218883. https://doi.org/10,1371/journal.pone.0218883
United States Environmental Protection Agency. EnviroAtlas. 2020 Dasymetric Population for the Conterminous United States, Alaska, Hawaii, Puerto Rico, and the US Virgin Islands. Accessed: [November, 2025] from https://www.epa.gov/enviroatlas
U.S. Census Bureau (2023). American Community Survey 5-year estimates. Retrieved from Census Reporter Profile page for Puerto Real, PR <http://censusreporter.org/profiles/16000US7265589-puerto-real-pr/>
U.S. Census Bureau. (2024, June). 2022 Community Resilience Estimates: Quick guide (Small Area Estimates Program, Social, Economic, and Housing Statistics Division) [PDF]. https://www2.census.gov/programs-surveys/demo/technical-documentation/community-resilience/2022/cre_quickguide_2022.pdf
U.S. Census Bureau. (2025, May 15). Community Resilience Estimates (CRE) for Puerto Rico. https://www.census.gov/programs-surveys/community-resilience-estimates/data/cre-pr.html
U.S. Geological Survey. (n.d.). USGS_Landslide_Density_Maria (FeatureServer) [ArcGIS REST service]. ArcGIS. https://services.arcgis.com/XG15cJAlne2vxtgt/arcgis/rest/services/Landslide_Density/FeatureServer